
A SURVEY ON IMAGE QUALITY ASSESSMENT TECHNIQUES USING GABOR FILTERS
- Deepa Maria Thomas, S. John Livingson
(DEEPA MARIA THOMAS, ROOM NO 303, DMR RESIDENCE, KARUNYA LADIES HOSTEL, KARUNYA UNIVERSITY, COIMBATORE-641114)
Abstract-Image quality assessment has a very important role, especially because the impact that the quality of images have on a viewer is significant. This makes it important that visual information is assessed for quality every now and then. Images can be distorted with different types of irregularities like noise, blur etc. No- reference image quality assessment methods does not need a reference image for assessment, this is particularly helpful when there is no reference image available. Gabor filters are efficient is assessing image quality because their frequency and orientation representations is very similar to the human visual system. This is why Gabor filters are used in feature extraction , target detection as well as texture segmentation. This paper is a survey of some of the no- reference image quality assessment methods that make use of Gabor filters in their quality assessment methodology wither for feature extraction or texture analysis.
Key words–image quality assessment, Gabor filter, no reference quality assessment.
INTRODUCTION
Images of good quality have come to be of great importance in our day to day life. Statistics suggest that an average person comes across 400 to 600 advertisements in a day. Pictures form a major portion of advertisements. Advertisement is just one area that makes use of images.
There are a lot of image quality assessment techniques available today. No-reference image quality assessment (NR-IQA) is one of the types in which the quality is estimated without the use of any reference image, whereas full reference image quality assessment (FR-IQA) make use of a reference image for quality assessment. Gabor filter is generally used for edge detection and it has the advantage that the frequency and orientation representations are very similar to the human visual system. Or in other words, the image analysis by Gabor functions is similar to the human perception. A set of Gabor filters with different frequencies and orientations are also useful for extracting useful features from an image.
GABOR FILTERS IN FEATURE EXTRACTION
Use of Gabor filter is motivated by the fact that they are optimal in time and frequency. In addition these filters can approximate the visual cortex of some mammals as described in [1]. This is why Gabor filters are used in many applications like target detection, image segmentation etc..

Figure 1: Two dimensional Gabor filter
Sources: http://en.wikipedia.org/wiki/Gabor_filter
NR-IQA USING GABOR FILTERS
No-reference image quality assessment is one of the types in which the quality is estimated without the use of any reference image, whereas full- reference techniques make use of a reference image for quality assessment. Described below are two no- reference image quality assessment techniques using Gabor filters.
NR-IQA USING VISUAL CODEBOOK (CBIQ)
The first step of this method [2] is codebook construction. It is built by dividing an image into BxB patches. All the constant patches are removed, for the rest of the patches Gabor feature vectors are computed. This is repeated for all the training images. Using this set, with a clustering algorithm the codebook is created. The input image is represented by the distribution of codewords from the codebook. The number of times the codeword is found and each time a nearest neighbor is found, the count is increased by one. If the distance between the vector of the feature and the nearest neighbor is larger than a predefined threshold, then it is considered as an outlier. In a case where a large number of outliers are encountered, then there might be some type of distortion which was not encountered in the training set. This image quality assessment technique is represented as CBIQ (Codebook Image Quality).The quality metric is Qm(I) and is given by,
Qm(I)=
where,
H1(i) is the probability of the occurrence of the code words
DMOS(C(i)) is the Differential Mean Opinion Scores of the codewords.
NR-IQA BASED ON VISUAL SALIENCY GUIDED SAMPLING (IQVG)
This method [3] is a no-reference image quality assessment method based on visual saliency. Visual saliency is what grabs our attention and it makes some parts of the image stand out from the rest. In this method firstly, a sufficient number of patches are sampled for which the mean saliency is greater than the threshold. Next, feature extraction is done by convolving each patch with Gabor filters. Using histograms the features are encoded, this gives an image representation. Using regression methods such as SVR the model can be trained. Finally, the quality of the test image is predicted automatically with a trained model.
FR-IQA USING GABOR FILTERS
The full reference method of image quality assessment is different from the no reference methods in that it does not make use of a reference image for quality assessment. Described below are two full reference image quality assessment techniques using Gabor filters.
FR-IQA USING FEATURE SIMILARITY INDEX (FSIM)
In this method [4] firstly, two image extractions are made namely, phase congruence (PC) and gradient magnitude (GM). PC is contrast invariant, this implies that the variations in quality due to contrast differences are not identified by PC. As a result of this, the GM needs to be extracted using gradient operators like Prewitt operator, Sobel operator and Scharr operator. Once the PC and GM are extracted for the reference image and the distorted image, FSIM can be computed to measure the similarity between the two images. The FSM can be calculated by combining similarity measure between images for both PC and GM given by

where,
 is the similarity measurement of PC
 is the similarity measurement of GM
 and are positive real numbers
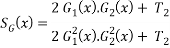
The combined similarity is given by 
 =
= .
. 
where,
α and β are parameters to adjust their relative weightage or importance.
Finally, the FSIM measure is given as below
FSIM= 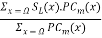
where,

FR-IQA USING PERCEPTUAL METHOD (MIGF)
One of the features necessary for good IQA is that it should be consistent with the subjective judgment of humans on the image. In this method [5] first, the features are extracted using a two dimensional Gabor filter which acts as a local band-pass filter with optimal localization properties. Next, divisive normalization transform (DNTF) is performed where the linear transform coefficient is normalized by the energy of a cluster of neighboring coefficients. This reduces the higher order dependencies in the extracted Gabor features. Next, the visual energy information (VEI) for each scale and orientation is given by

where,
λ is the scale, θ is the orientation
 is real part of DNTF
 is the imaginary part of DNTF
Once the VEI is calculated, the mutual information (MI) can be calculated as the difference between the VEI obtained from the reference image and distorted image. MI can be calculated using marginal probability distribution and joint probability distribution. The quality score is as described below
Score=
where,
 and
and  denote the VEI of the reference image and distorted image respectively at scale i and orientation θ.
COMPARISON OF IQA TECHNIQUES:
The table below shows a comparison between the four techniques described above. It describes the merits and demerits of the four IQA methods.
TABLE – 1
COMPARISON TABLE
|
IQA |
MERITS |
DEMERITS |
|
CBIQ |
This method can be used to implement parallel computation. This method can be extended to any type of distortion |
The cost of computation increases sub linearly with the increase of codebook size. |
|
IQVG |
IQVG uses the distribution of local feature to quantize, this reduces cost of computation since codebooks are not used. |
IQVG provided slightly lesser performance than CBIQ for JPEG images. |
|
FSIM |
The method has high correlation with the subjective assessment. This method provides better performance than IQVG and CBIQ |
This method uses a reference image for IQA. |
|
MIGF |
The method has a high correlation with the subjective assessment. This method provides better performance than most other IQA of structural similarity algorithms |
This method uses a reference image for IQA. |
CONCLUSIONS
This work provides the comparative study of some of the IQA methods in image processing. The algorithms that were considered were both no – reference and full – reference algorithms. All the IQA methods discussed here make use of Gabor filters in one way or another. This paper highlights importance of Gabor Filters in image quality assessment.
REFERENCES:
[1] Anjali G. (2012), “For image enhancement and segmentation by using evaluation of Gabor filter parameters.” IJATER, 2, 46-56.
[2] Peng Y. and David D. (2014), “No- reference image quality assessment based on visual codebook.” Feature Similarity Index for Image Quality Assessment.” IEEE Trans. IP, 21, 3129-3138.
[3] Zhongyi G., Lin Z. and Hongyu L., (2013),“Learning a bling image quality index based on visual saliency guided sampling and Gabor filtering.” ICIP, 186-190.
[4] Lin Z. and Xuanqin M., (2011), “FSIM: Feature Similarity Index for Image Quality Assessment .” IEEE Trans. IP, 20, 2378-2386
[5] Ding Y., Zhang Y., Wang X., Yan X. and Krylov A.S. (2014), “Perceptual image quality metric using mutual information of Gabor features.” Science China Information Sciences, 57,032111:1-032111:9.
Cite This Work
To export a reference to this article please select a referencing style below: